MULLENS – The Changing Nature of Hazardous Weather and Implications for Transportation: Example from Oklahoma, USA
Esther Mullens, Renee McPherson
Article first published online: 20 January 2023
DOI: https://doi.org/10.3390/cli11020032
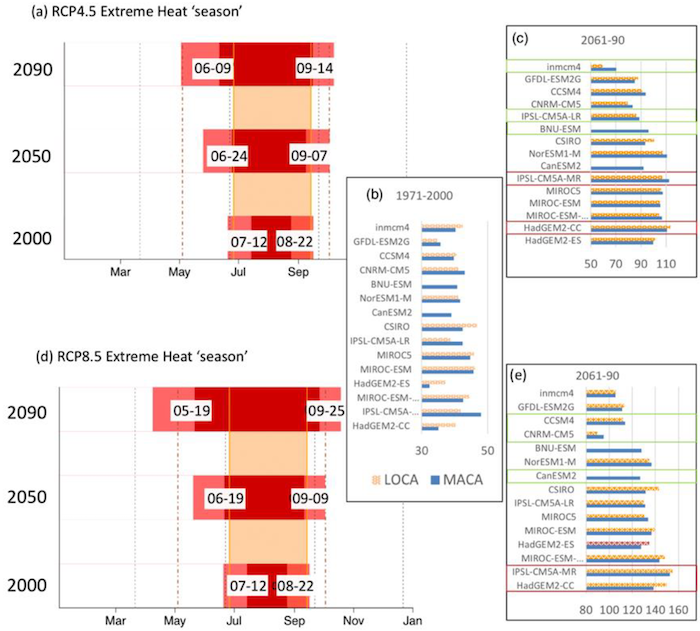
ABSTRACT: Central Oklahoma is undergoing investment in new intermodal transportation and rehabilitation of its infrastructure. Despite a highly variable historical climate, future changes resulting from anthropogenic climate change may be outside of the range for which infrastructure was designed. We examined 21st century trends, focusing on weather and climate extremes of demonstrated importance to transportation professionals as identified through expert input. We assessed trends from a suite of 15 global climate models (GCMs) using two emissions scenarios and two high-resolution statistically downscaled datasets. This ensemble provided a quantitative range for potential future climate conditions whilst revealing uncertainties associated with different models and downscaling methods. Our results support the general consensus of a reduction in the frequency of cold temperatures, freeze–thaw cycles, and winter weather; however, for the latter, there is not necessarily a reduction in intensity. Extreme heat days (e.g., days ≥100 °F) increased by factors of 3–6, with this upper range associated with high greenhouse gas emissions, while the seasonal duration of extreme heat extended by 4–10 weeks. Projected return intervals for heavy rainfall increased in frequency and magnitude in the mid and late 21st century. Although the contribution of the emissions pathway to these changes is evident, different extreme value distributions and the varying simulations of precipitation from the GCMs have a large effect on magnitudes, leading to a range of possible futures to consider in infrastructure design. Precipitation metrics, particularly at the extremes, were more sensitive to the selection of downscaled data, as compared with temperature metrics. Our approach represents a resource for transportation professionals seeking to identify changing risk probabilities at regional to local scales, as a precursor to planning and adaptation.
Read the full publication in Climate.