AMANAMBU, MOSSA – Machine learning insights of anthropogenic and natural influences on riverbed deformation in a large lowland river
Amobichukwu C. Amanambu, Joann Mossa
Article first published online: 28 November 2023
DOI: https://doi.org/10.1016/j.geomorph.2023.108986
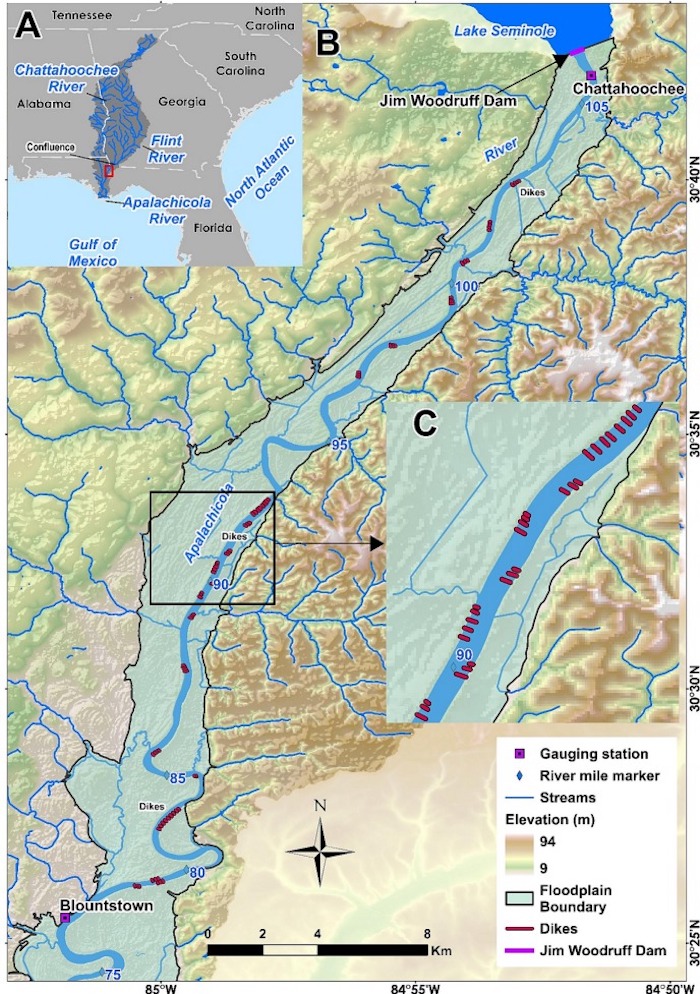
ABSTRACT: As escalating environmental pressures threaten the world’s river systems, understanding the driving factors influencing their geomorphological changes is of critical global importance. This study illuminates the complex interaction between natural and anthropogenic factors that drove geomorphological changes along the upper Apalachicola River (UAR) from 1960 to 2010. This study utilized LiDAR point cloud data and hydrographic surveys conducted between 1960 and 2010 to identify the primary factors driving riverbed changes. A triangular irregular network (TIN) was used to convert the combined datasets from each survey, following coordinate transformation, into a 1.5 m-resolution digital elevation model (DEM) raster. The DEM of difference (DEMoD) was computed by subtracting the 1960 DEM from that of 2010, and the total sediment loss and gain were then determined by multiplying the DEMoD by the DEM resolution. A random forest (RF) regression model was used to determine the most influential factors contributing to riverbed deformation. The results revealed substantial differences in sediment loss and gain across the river. The UAR, divided into three segments, experienced sediment loss of about −6.56 × 10⁶ m3 between 1960 and 2010, with the farthest upstream section (RM 106 to 98) losing −3.14 × 10⁶ m3, which is ~48 % of the sediment losses in the study area. Some sections of the channel have deepened significantly, with a pronounced depth difference of −17.20 m between RM 92 and 94, potentially caused by the presence of limestone and the enlargement of a sinkhole or spring on the riverbed. The RF model identified the dam (>28 %) as the most crucial anthropogenic factor in riverbed deformation, followed by the presence of dikes (~17—18 %), then historical dredging (~7—8 %), highlighting the substantial impact of artificial structures on riverbed deformation. In contrast, rock removal, while potentially impactful in certain locations, had negligible effects (>0.5 %) at the system scale. This study highlights the interaction of natural and anthropogenic factors in river geomorphology and the potential for machine learning to identify these dynamics and inform data-driven river management and conservation strategies.
Read the full publication in Geomorphology.