NORRIS – Excess mortality in Ukraine during the course of COVID-19 pandemic in 2020–2021
Aleksandr Shishkin, Pema Chewa, Chen Yang, Yuriy Gankin, Gerardo Chowell, Michael Norris, Pavel Skums, Alexander Kirpich
Article first published online: 27 April 2023
DOI: https://doi.org/10.1038/s41598-023-33113-2
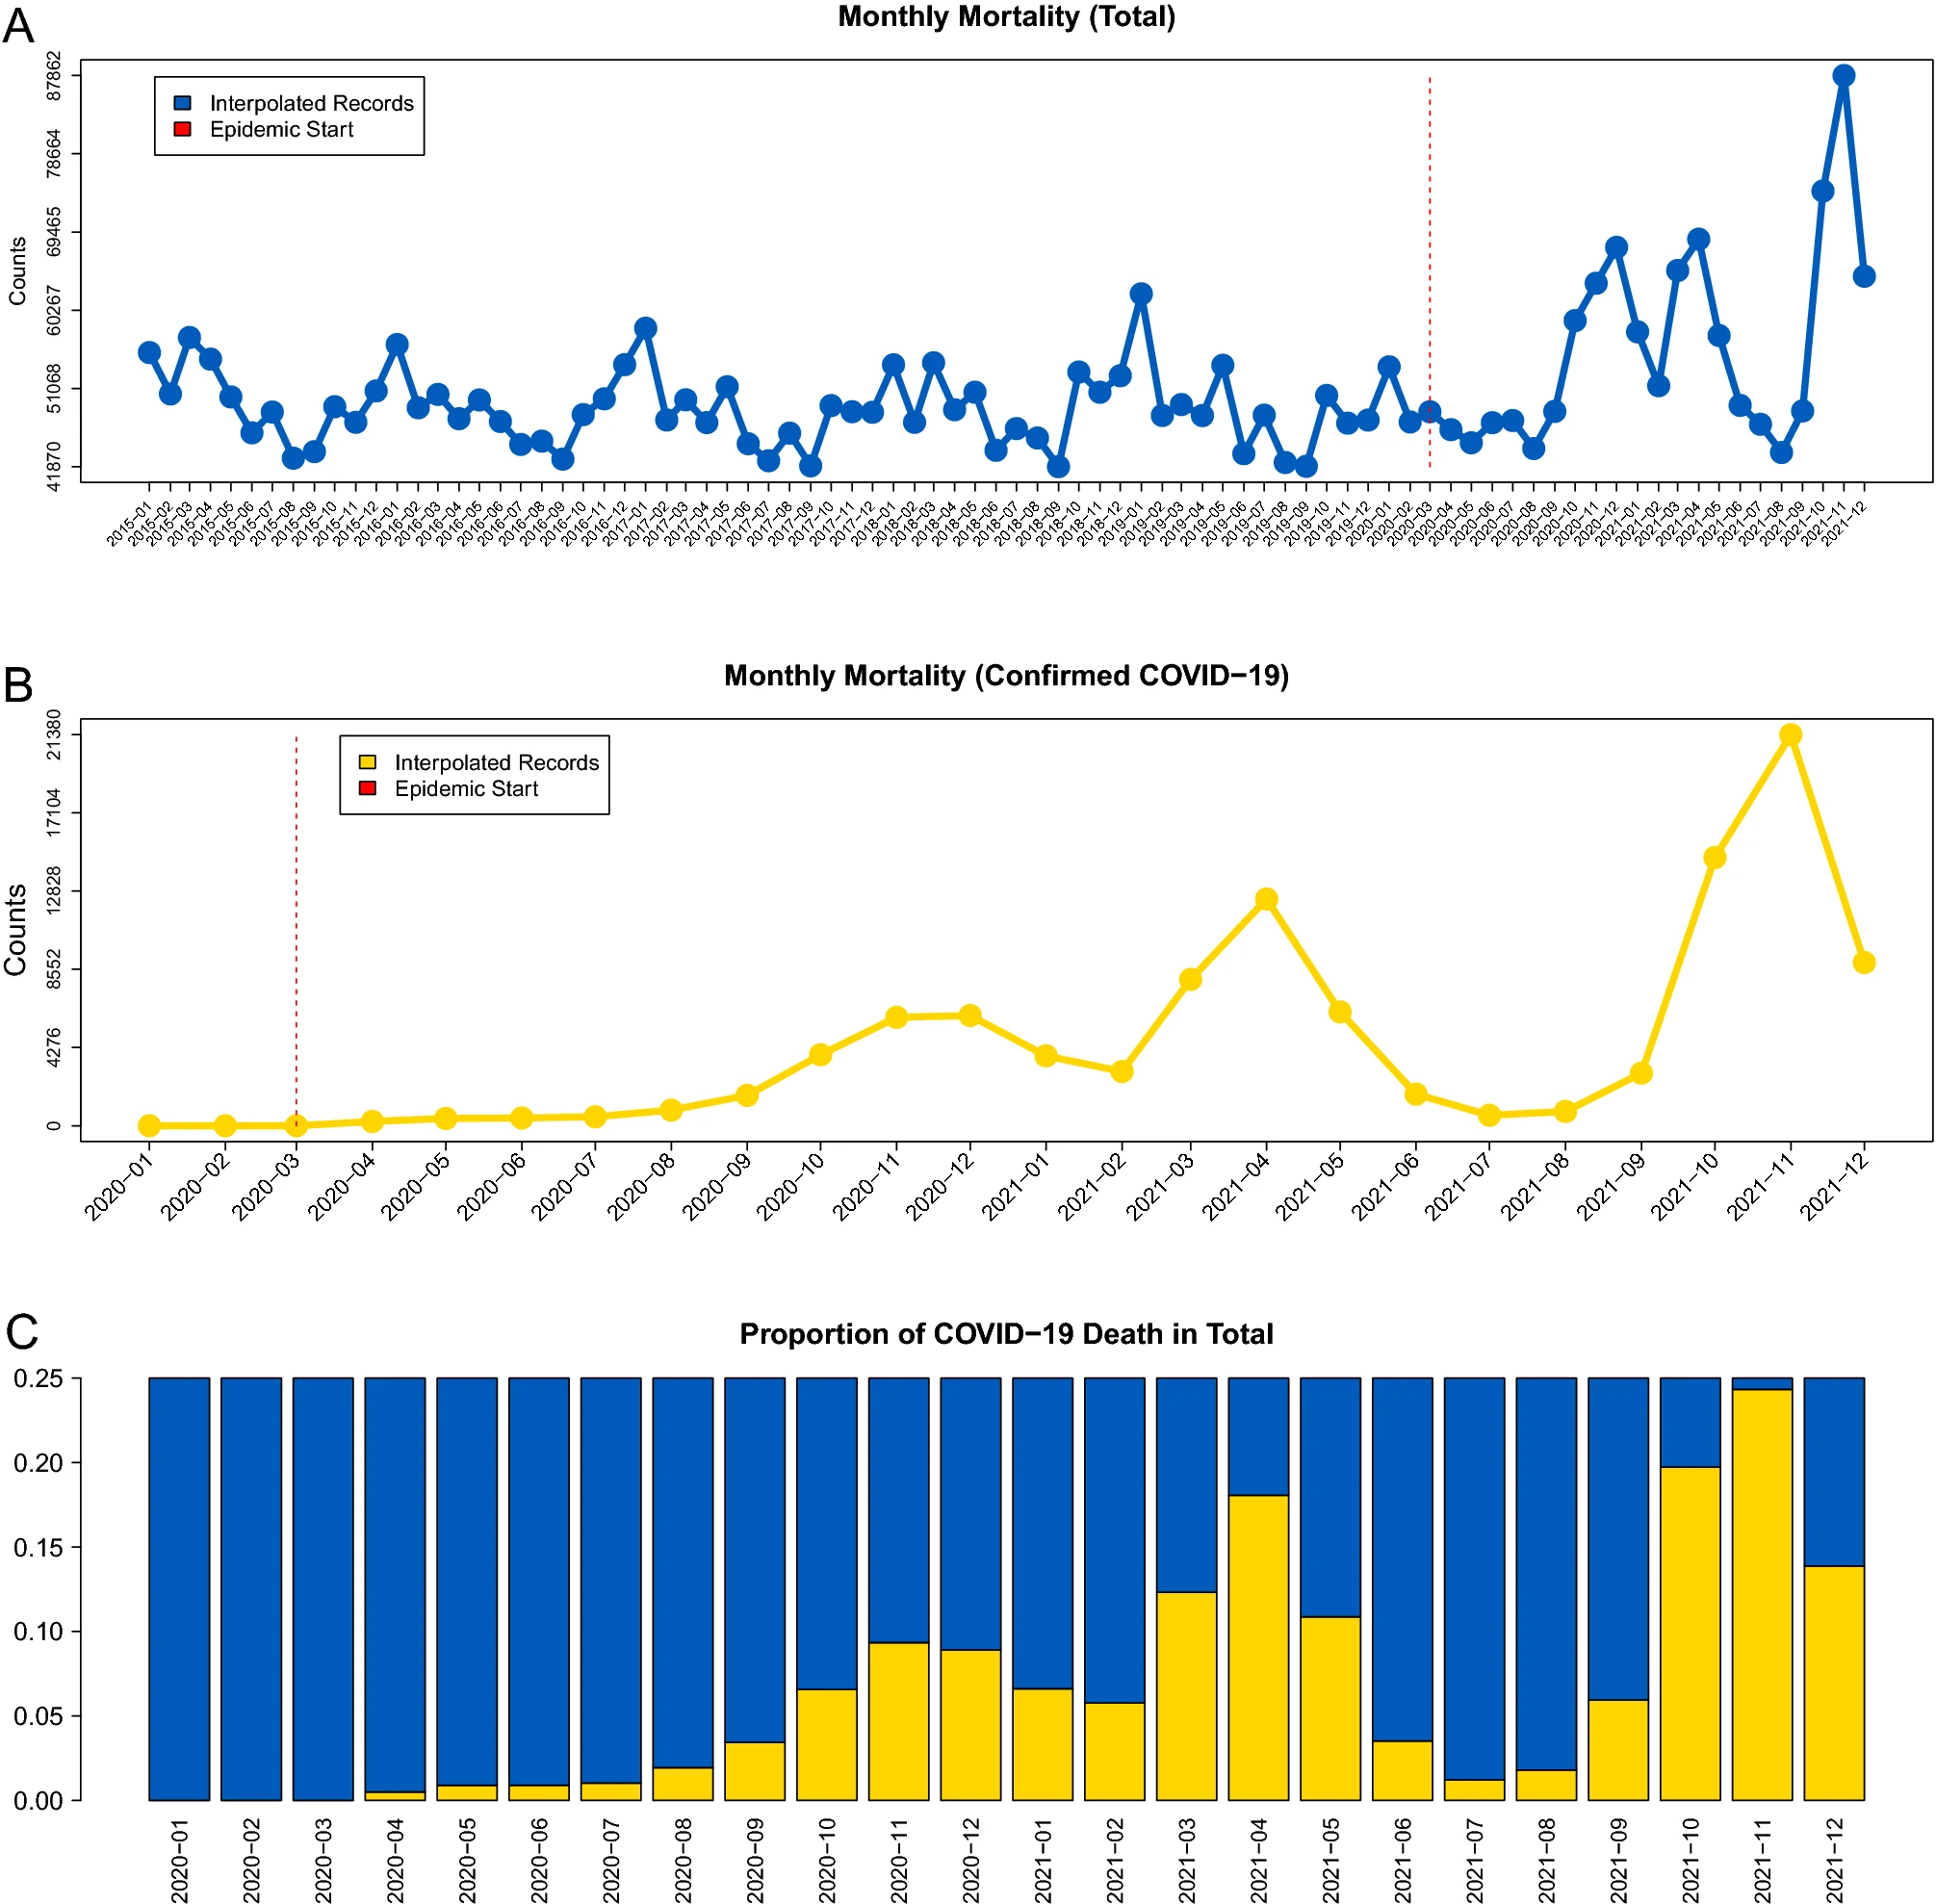
ABSTRACT: In this work, the COVID-19 pandemic burden in Ukraine is investigated retrospectively using the excess mortality measures during 2020–2021. In particular, the epidemic impact on the Ukrainian population is studied via the standardized both all-cause and cause-specific mortality scores before and during the epidemic. The excess mortality counts during the pandemic were predicted based on historic data using parametric and nonparametric modeling and then compared with the actual reported counts to quantify the excess. The corresponding standardized mortality P-score metrics were also compared with the neighboring countries. In summary, there were three “waves” of excess all-cause mortality in Ukraine in December 2020, April 2021 and November 2021 with excess of 32%, 43% and 83% above the expected mortality. Each new “wave” of the all-cause mortality was higher than the previous one and the mortality “peaks” corresponded in time to three “waves” of lab-confirmed COVID-19 mortality. The lab-confirmed COVID-19 mortality constituted 9% to 24% of the all-cause mortality during those three peak months. Overall, the mortality trends in Ukraine over time were similar to neighboring countries where vaccination coverage was similar to that in Ukraine. For cause-specific mortality, the excess observed was due to pneumonia as well as circulatory system disease categories that peaked at the same times as the all-cause and lab-confirmed COVID-19 mortality, which was expected. The pneumonias as well as circulatory system disease categories constituted the majority of all cases during those peak times. The seasonality in mortality due to the infectious and parasitic disease category became less pronounced during the pandemic. While the reported numbers were always relatively low, alcohol-related mortality also declined during the pandemic.
Read the full publication in Scientific Reports.