CAPPS HERRON, WAYLEN – Spatial and temporal variability in the characteristics of extreme daily rainfalls in Ghana
Holli Capps Herron, Peter Waylen, Kwadwo Owusu
Article first published online: 24 February 2023
DOI: https://doi.org/10.1007/s11069-023-05876-4
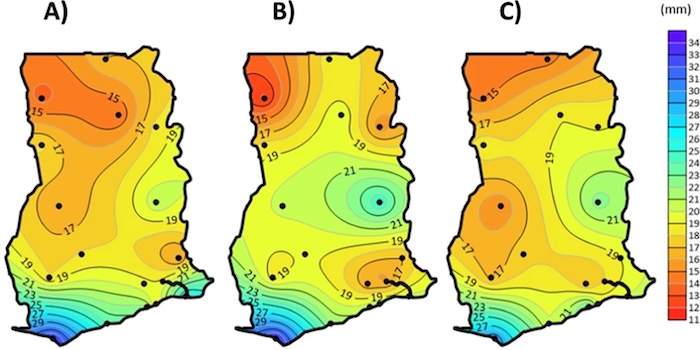
ABSTRACT: Focus on potentially increased frequency of extreme hydro-climatological events under climate change is intensified by Ghana’s reliance on rainfed agriculture, and the question whether precipitation climatology has returned to conditions prevailing before the regional drought of the 1970s and 80s. This study examines long-term (44–51 years), complete, daily rainfall records from nineteen stations nationally to determine magnitude and frequency of totals in excess of the historical 90th percentile at each station. Results are divided into three sub-populations corresponding to pre-drought, drought, and post-drought periods. Four research questions are addressed; (1) Is there evidence of significant interdecadal scale variability in these variables, (2) are there significant differences in characteristics between periods, (3) are there any distinctive regional patterns in changes, and (4) can findings be extended to various definitions of what constitutes extreme rainfalls? The Mann–Whitney U test determines significant breaks that define the overarching temporal framework of the research. The hypergeometric distribution determines the statistical significance of changes in magnitude and frequency. Exponential, generalized Pareto and Poisson distributions are fit to the magnitude and frequency of post-drought data. Recovery is broadly defined as no difference between pre-drought and post-drought data. Some locations in mid-Ghana have recovered, while coastal areas have not recovered in frequency or magnitude. Outliers correspond to Axim in the southwest and Navrongo in the north. The anomalies at Kete Krachi, located on Lake Volta, may result from its local climatological setting. Contributions of the research include the first comprehensive, national review of the characteristics of magnitude and frequency of large rainfall totals. The outstanding question of whether “climate” has returned to pre-1970 levels has been explicitly addressed in the context of the important facet of precipitation climatology. Results provide some insight into one of the frequently expressed thoughts that climate change/variability may be most sensitively expressed through changes in the frequency of processes/extreme events. Finally, it suggests a potential tool that may be used to estimate risks of extremely rare events, based on the most recent (Period 3), which is a reasonably stationary dataset.
Read the full publication in Natural Hazards.