KIM, MATYAS – Spatial Variations in Tropical Cyclone Rainfall over the Western North Pacific According to ENSO Phase
Dasol Kim, Doo-Sun Park, Corene Matyas
Article first published online: 16 February 2023
DOI: https://doi.org/10.1175/JCLI-D-22-0231.1
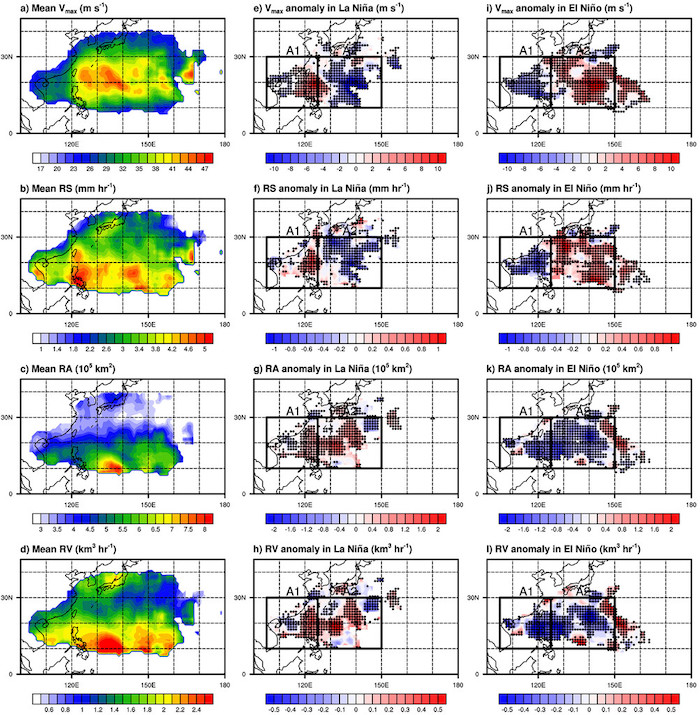
ABSTRACT: This study investigated spatial variations in rainfall accompanying tropical cyclones (TCs) over the western North Pacific (WNP) from June to October over 1998–2019 according to phases of El Niño–Southern Oscillation (ENSO). The rainfall characteristics of TCs include rainfall strength (RS) in the core region, total rainfall area (RA), and total rainfall volume (RV), all of which were calculated from satellite precipitation data. Spatial variation in mean RS presents a west–east dipole pattern (i.e., increases in the west of 125°E and decreases in the east during La Niña, and vice versa during El Niño) similar to that of maximum wind speed (Vmax), indicating a close relationship between them. On the other hand, both of mean RA and RV homogeneously increase during La Niña over the entire basin while they decrease during El Niño. The environmental conditions around TCs, including sea surface temperature, total column water, and divergence in the upper and lower troposphere during La Niña appear generally favorable for precipitation, while those during El Niño are unfavorable. Using multivariable regression models, we quantified the contributions of Vmax and environmental conditions to the variations in TC rainfall. Overall results suggest that the variation in RS according to ENSO are mainly related to Vmax, while those of RA and RV are strongly controlled by environmental conditions.
Read the full publication in the Journal of Climate.