ALRUZUQ, MOSSA, ASH – Socio-hydrology and vulnerability of levee systems along the lower Illinois River
Ali Rashed Alruzuq, Jonathan W. F. Remo, Joann Mossa, Kevin Ash
Article first published online: 23 January 2023
DOI: https://doi.org/10.1080/19475683.2023.2166113
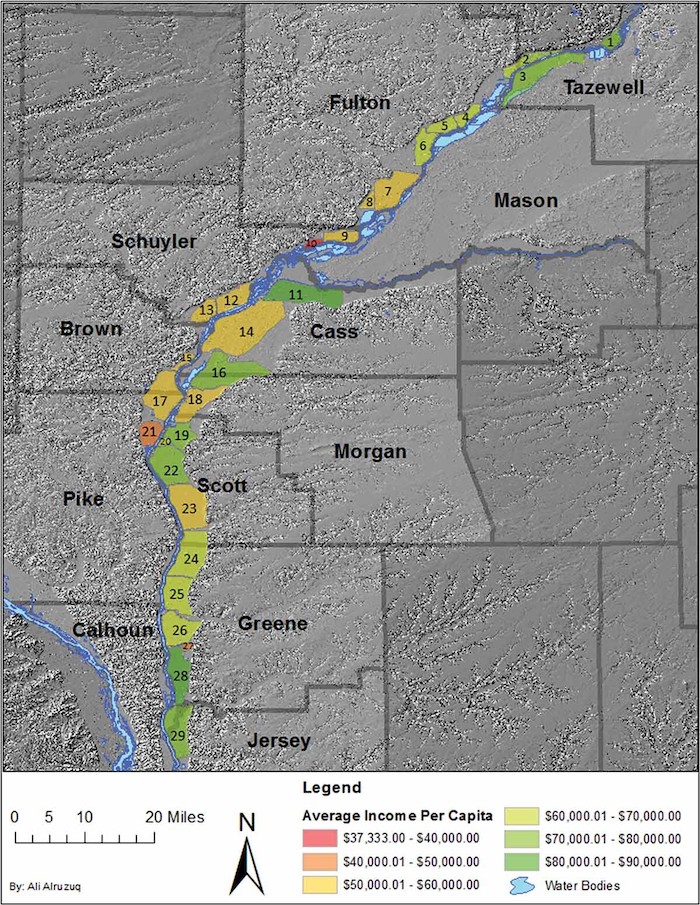
ABSTRACT: The maintenance of flood mitigation levees in the U.S. and elsewhere, has often found to be insufficient. Recent U.S. levee safety inspections have discovered substantial deficiencies in many federally monitored levees resulting in some of them being assigned an ‘unacceptable’ safety rating. Most levees in the U.S. were constructed using federal money but then were turned over to local government entities to maintain, thus socioeconomic characteristics of these communities may impact their ability to maintain their levee(s). We used dasymetric mapping to assign socioeconomic parameters to levee protected areas along the lower Illinois River to explore differences in these characteristics between communities with an unacceptable levee safety rating to those with an acceptable rating. Principal components analysis was used to determine which socioeconomic parameters explained the majority of variance between levee protected communities and the Mann-Whitney-Wilcoxon U-Test for significance testing. These analyses revealed that differences in total population , race, average per-capita income, and number of residential homes were influential indicators for explaining differences between comunities with levees with acceptable versus unacceptable ratings. These results suggest populations who inhabit levee systems with unacceptable safety ratings are white and relatively wealthier than communities located within levee systems with acceptable ratings. This finding is counter to research that shows that the poor and poorer minorities live in areas with higher flood risk. This is perhaps wealthier floodplain property owners inhabitating unacceptable levee systems may be foregoing necessary levee maintenance, inastead relying on other government programs to pay for flood damages.
Read the full publication in the Annals of GIS.