SOUTHWORTH – Comparison of NDVI Values from Multiple Satellite Sensors to Monitor for Public Health in an Urban Sub-tropical Setting
Julius R. Dewald, Jane Southworth, Scott C. Brown, Jose Szapocznik
Article first published online: 24 November 2022
DOI: http://article.sapub.org/10.5923.j.ajgis.20221102.01.html
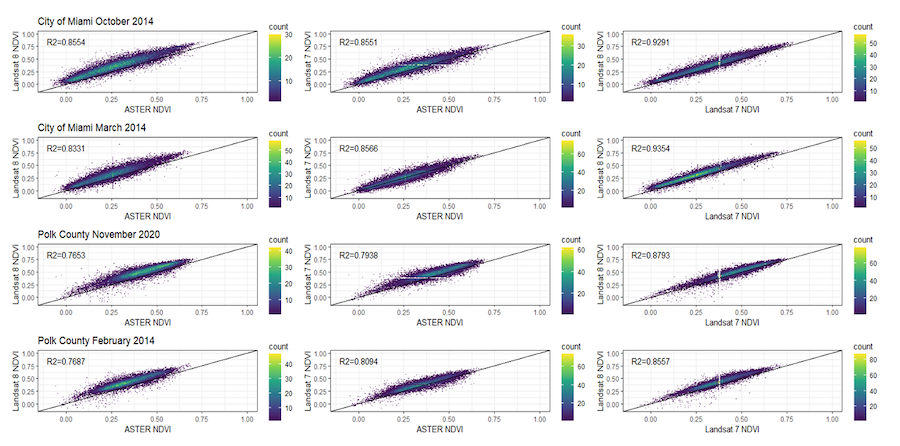
ABSTRACT: Normalized Difference Vegetation Index (NDVI) is commonly used as a measure of greenness in public health research. Changes in NDVI over time in urbanized areas have been linked to improvements to multiple chronic conditions. Studies have been conducted using ASTER or Landsat, but their equivalence has not been established. To determine the equivalence or lack thereof between ASTER and Landsat, and between Landsat 7 and 8, this study compares NDVI values from ASTER, Landsat 7, and Landsat 8 satellite sensors at different times of the year (Fall and Spring) and at different locations in Florida (the City of Miami and Polk County). Although other studies have examined how Landsat and ASTER NDVI values compare, no study has explicitly investigated how NDVI values differ across ASTER and Landsat for urban areas. A comparison of the scatterplots of ASTER with Landsat satellite sensor NDVI scores, produced R2 values consistently above 0.75 with p-values less than 0.001 across both locations and times of the year, indicating that Landsat and ASTER-derived NDVI values share considerable variance. By repeating these analyses separately by season and location, we demonstrated that the relationship between Landsat and ASTER NDVI varies more by season than location within urban subtropical settings. These findings suggest that studies comparing NDVI values from these different satellite sensors would require calculating separate coefficients for each season.
Read the full publication at the International Journal of Geographic Information System.