BLACKBURN – Anthrax hotspot mapping in Kenya support establishing a sustainable two-phase elimination program targeting less than 6% of the country landmass
John Gachohi, Bernard Bett, Fredrick Otieno, Eddy Mogoa, Peris Njoki, Mathew Muturi, Athman Mwatondo, Eric Osoro, Isaac Ngere, Jeanette Dawa, Carolyne Nasimiyu, Harry Oyas, Obadiah Njagi, Samuel Canfield, Jason Blackburn, & Kariuki Njenga
Article first published online: 15 December 2022
DOI: https://doi.org/10.1038/s41598-022-24000-3
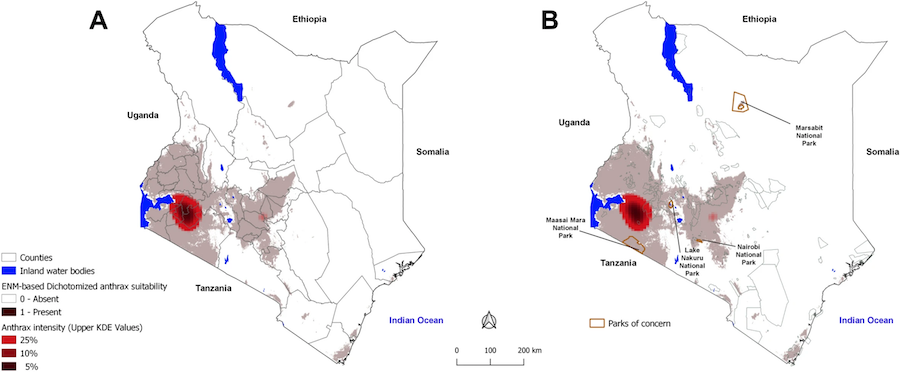
ABSTRACT: Using data collected from previous (n = 86) and prospective (n = 132) anthrax outbreaks, we enhanced prior ecological niche models (ENM) and added kernel density estimation (KDE) approaches to identify anthrax hotspots in Kenya. Local indicators of spatial autocorrelation (LISA) identified clusters of administrative wards with a relatively high or low anthrax reporting rate to determine areas of greatest outbreak intensity. Subsequently, we modeled the impact of vaccinating livestock in the identified hotspots as a national control measure. Anthrax suitable areas included high agriculture zones concentrated in the western, southwestern and central highland regions, consisting of 1043 of 1450 administrative wards, covering 18.5% country landmass, and hosting 30% of the approximately 13 million cattle population in the country. Of these, 79 wards covering 5.5% landmass and hosting 9% of the cattle population fell in identified anthrax hotspots. The rest of the 407 administrative wards covering 81.5% of the country landmass, were classified as low anthrax risk areas and consisted of the expansive low agricultural arid and semi-arid regions of the country that hosted 70% of the cattle population, reared under the nomadic pastoralism. Modelling targeted annual vaccination of 90% cattle population in hotspot administrative wards reduced > 23,000 human exposures. These findings support an economically viable first phase of anthrax control program in low-income countries where the disease is endemic, that is focused on enhanced animal and human surveillance in burden hotspots, followed by rapid response to outbreaks anchored on public education, detection and treatment of infected humans, and ring vaccination of livestock. Subsequently, the global anthrax elimination program focused on sustained vaccination and surveillance in livestock in the remaining few hotspots for a prolonged period (> 10 years) may be implemented.
Read the full publication at Scientific Reports.