JING, HU – Identifying critical transfer zones to coordinate transit with on-demand services using crowdsourced trajectory data
Jiahua Qiua, Yue Jing, Wang Peng, Lili Du, Yujie Hu
Article first published online: 21 November 2022
DOI: https://doi.org/10.1080/15472450.2022.2132389
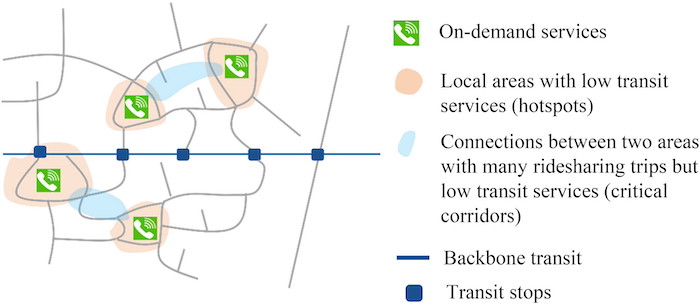
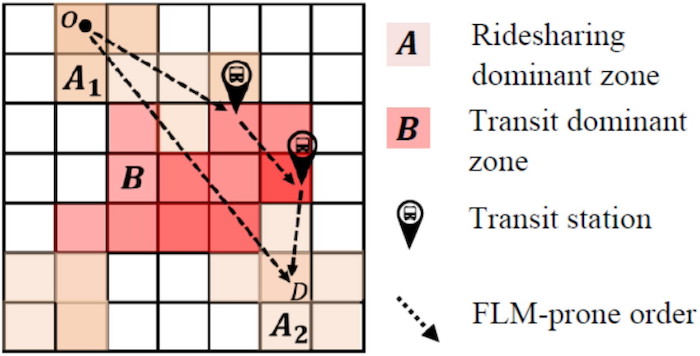
ABSTRACT: This study develops a data-driven approach for identifying critical transfer zones in the city to facilitate the coordination of transit and emerging on-demand services. First, the methods convert the trajectories into a 3 D grid with an optimal cube size. Built upon that, we zoom in and study the trajectory density of each mode in a cube and present the results by heatmaps. After that, we zoom out and aggregate those cube information fragments through the clustering algorithms to explore two critical patterns: the ridesharing swarm (RS) zones where many ridesharing trips go through, and the “sandwich pattern” zones where a transit trajectory dominant zone is sandwiched by two ridesharing trajectory dominant zones. Our numerical analysis confirms that these RS zones are well correlated to the promising areas/corridors for integrating transit and on-demand services; the “sandwich patterns” help discover first/last mile (FLM) zones. Last, we further develop a two-channel deep learning network to predict the variation of the FLM gaps so that adaptive services can be planned. A case study based on the field data of the second ring region of Chengdu, China confirms the effectiveness and capability of our analysis approach.
Read the full publication at the Journal of Intelligent Transportation Systems.