MEHEDY, SOUTHWORTH – Mapping fire-impacted refugee camps using the integration of field data and remote sensing approaches
Mohammad Mehedy Hasan, Ikramul Hasan, Jane Southworth, Tatiana Loboda
Article first published online: 21 November 2022
DOI: https://doi.org/10.1016/j.jag.2022.103120
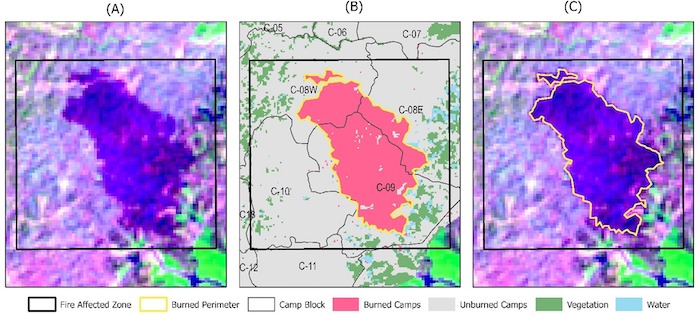
ABSTRACT: The impacts of fires on society and the environment are wide-ranging, and examining such fire incidents is of critical importance to communities, governments, and scientists. Satellite imagery analysis enables the monitoring of burned scars and can help us better understand the social, ecological, and economic consequences of fires in more detail. However, most satellite studies measuring fire area and impacts focus on large areas in natural landscapes, typically forests. We highlight the need to develop methods for fire detection and analysis in human-dominated landscapes, specifically, such vulnerable populations as those found in refugee camps globally. We calculate a suite of spectral indices (SI’s) developed from Sentinel-2 data with a random forest algorithm to quantify the fire impact on the Rohingya refugee camps in Teknaf, Bangladesh. For this study, we developed a method called the Fractional Charred Index (FCI) using the field plots within the burn areas inside the refugee camp settlements and compared the FCI with differenced Spectral Indices (dSI’s) to quantitively assess the burn severity at four levels: (i) high severity, (ii) moderate severity, (iii) low severity and (iv) unburned camp. Our study identified 140 acres of burn area, damaging over 8,000 refugee shelters, 1,760 of which were severely damaged and 3,452 of which suffered moderate damage. The FCI-dSIs relationship was measured by a simple linear model which indicated that the differenced Normalized Burned Index (dNBR) and the differenced Char Soil Index (dCSI) have the strongest positive correlation and can be used interchangeably to assess the scale and intensity of the fire-caused damage and fire severity assessment in this and similar types of case studies. The novel method presented here to determine fire severity in human-dominated landscapes, specifically refugee camps, may be quickly deployed and is easily interpretable and computationally inexpensive. Therefore, the proposed method of identifying burned settlements in refugee camps has significant potential for impact monitoring, disaster management, and recovery efforts after such fire events.
Read the full publication at the International Journal of Applied Earth Observation and Geoinformation.