University of Florida Homepage

RESEARCH HIGHLIGHT

Perception bias: Deciphering a Mismatch Between Urban Crime and Perception of Safety

PURPOSE

In his research, Dr. Yujie Hu explores how to answer one question—are places looking safe really safe or vice versa?

Picture of Dr. Yujie HuDR. YUJIE HU

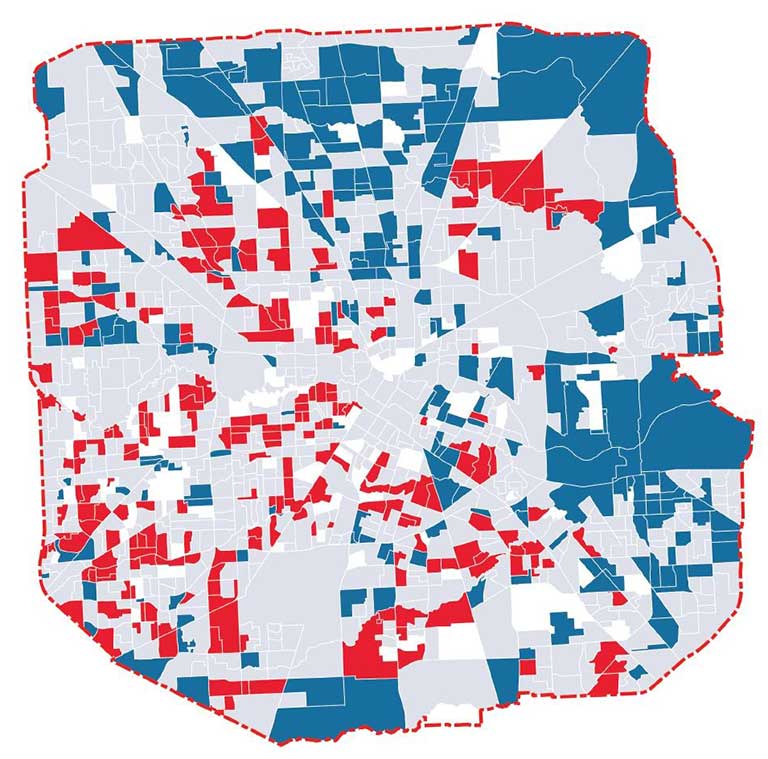
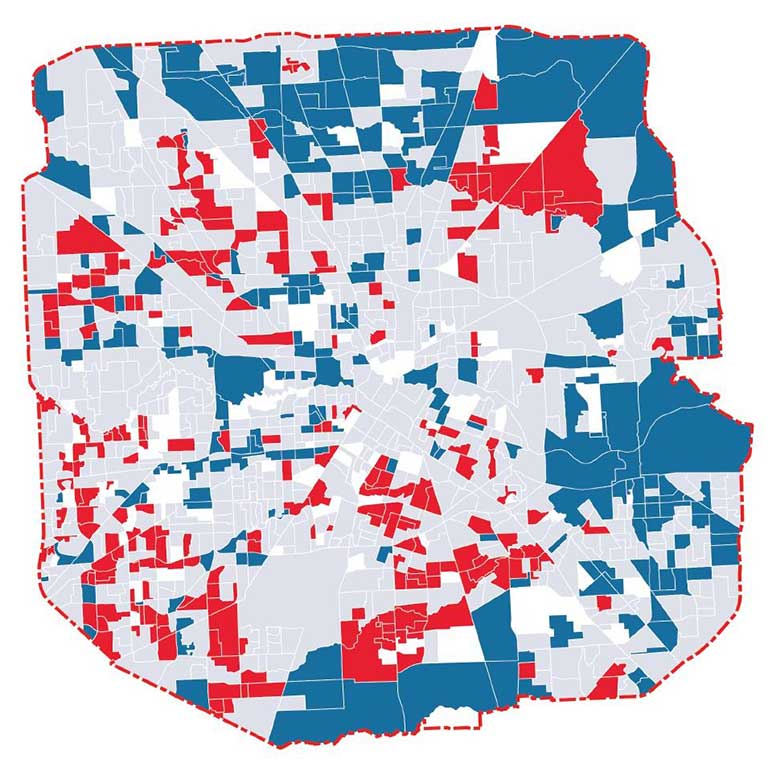
Step 1: Evaluate People’s Risk Perception

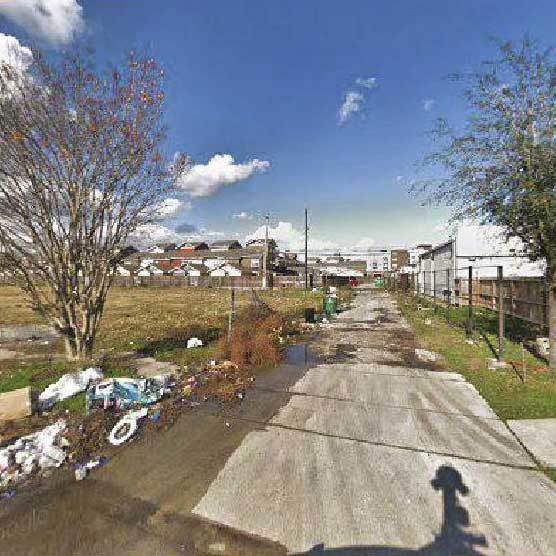
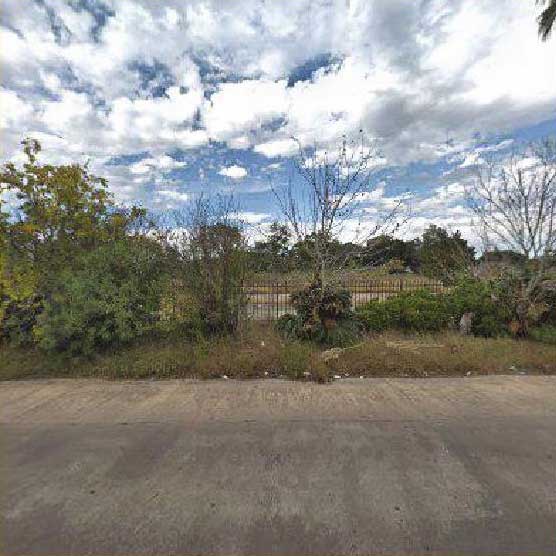
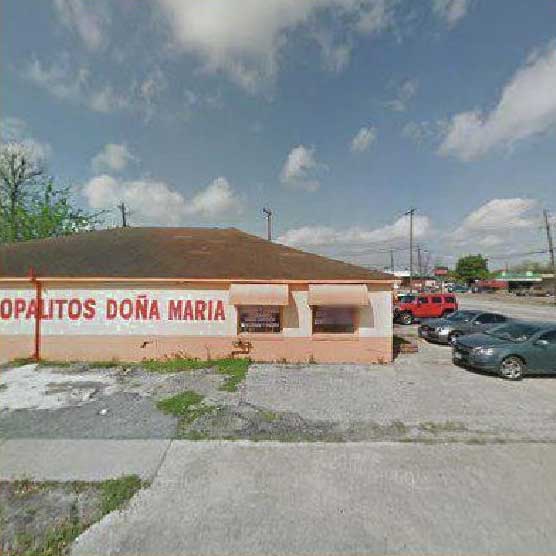
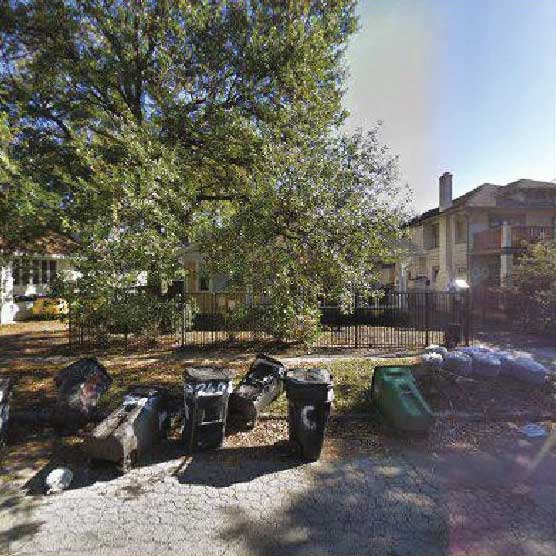
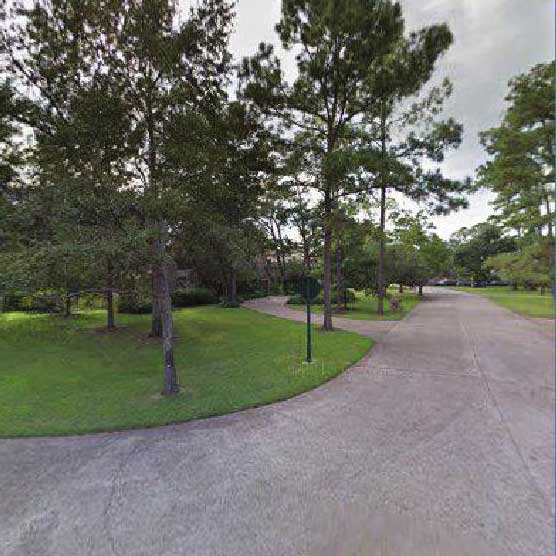
Utilize deep learning to analyze 384,180 Google Street View images and evaluate people’s risk perception of streets and neighborhoods in Houston. Below are sample images that demonstrate perceived high and low safety scores.


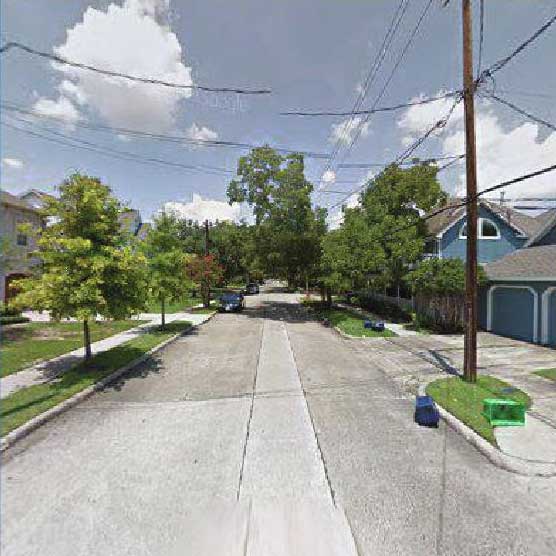
ROW A: IMAGES WITH HIGH SAFETY SCORES


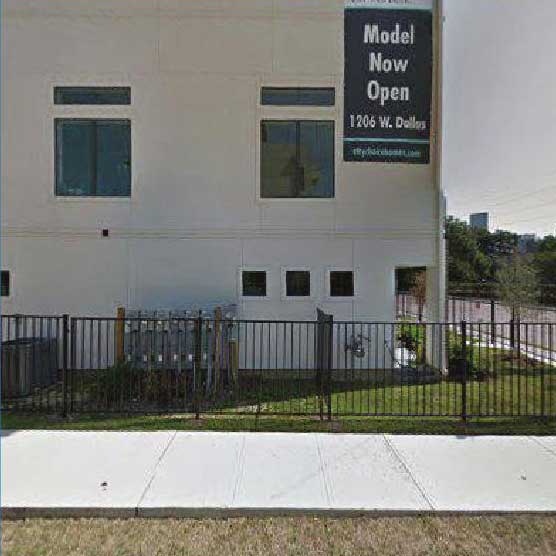
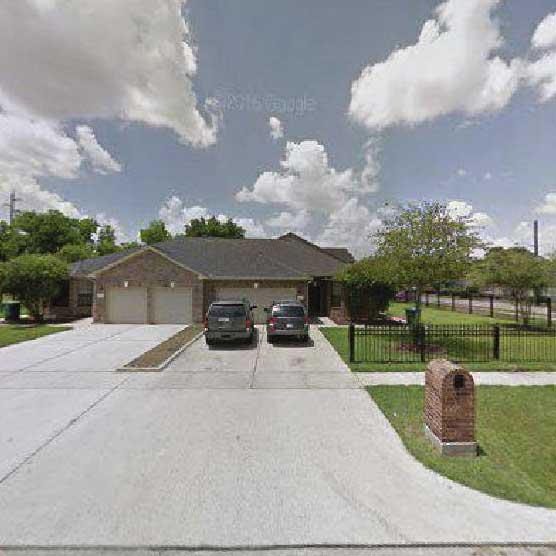
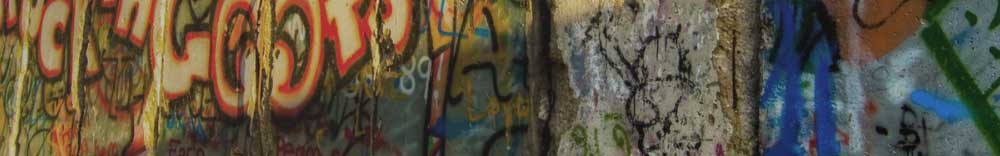
ROW B: IMAGES WITH LOW SAFETY SCORES


Step 2: Compare Perception with Actual Risk Level

The derived risk perception is then compared with the actual risk level measured by crime rates to reflect the so-called perception bias. Results capture the level of mismatch between people’s visually perceived safety and the actual crime rates. This measure provides scalable guidance in deciphering the relationship between the built environment and crime. This research can enhance our capacity to design urban management strategies that prevent the emergence of extreme “perception bias”.


GEOGRAPHICAL DISTRIBUTION OF THE “PERCEPTION BIAS” IN THE STUDY AREA


Picture showing some areas being perceived as more dangerous than it looks, a slightly higher number being perceived as less dangerous than it looks, and the majority of areas being about the same.
A: Other crime per thousand residents
Picture showing some areas being perceived as more dangerous than it looks, a slightly higher number being perceived as less dangerous than it looks, and the majority of areas being about the same.
B: Violent crime per thousand residents

More dangerous than it looks

Similar

Safer than it looks


Research Highlights

1Predicted “Perception of Safety Scores” are significantly associated with reported crime.
2There exists a “Perception Bias” between the perception of safety and reported crimes.
3Intensive daytime activities indicate places “safer than they look”.
4More visits at night implies places being “more dangerous than they look”.
5Places with more education facilities may have more crimes but still look safe.
Read the Full Paper